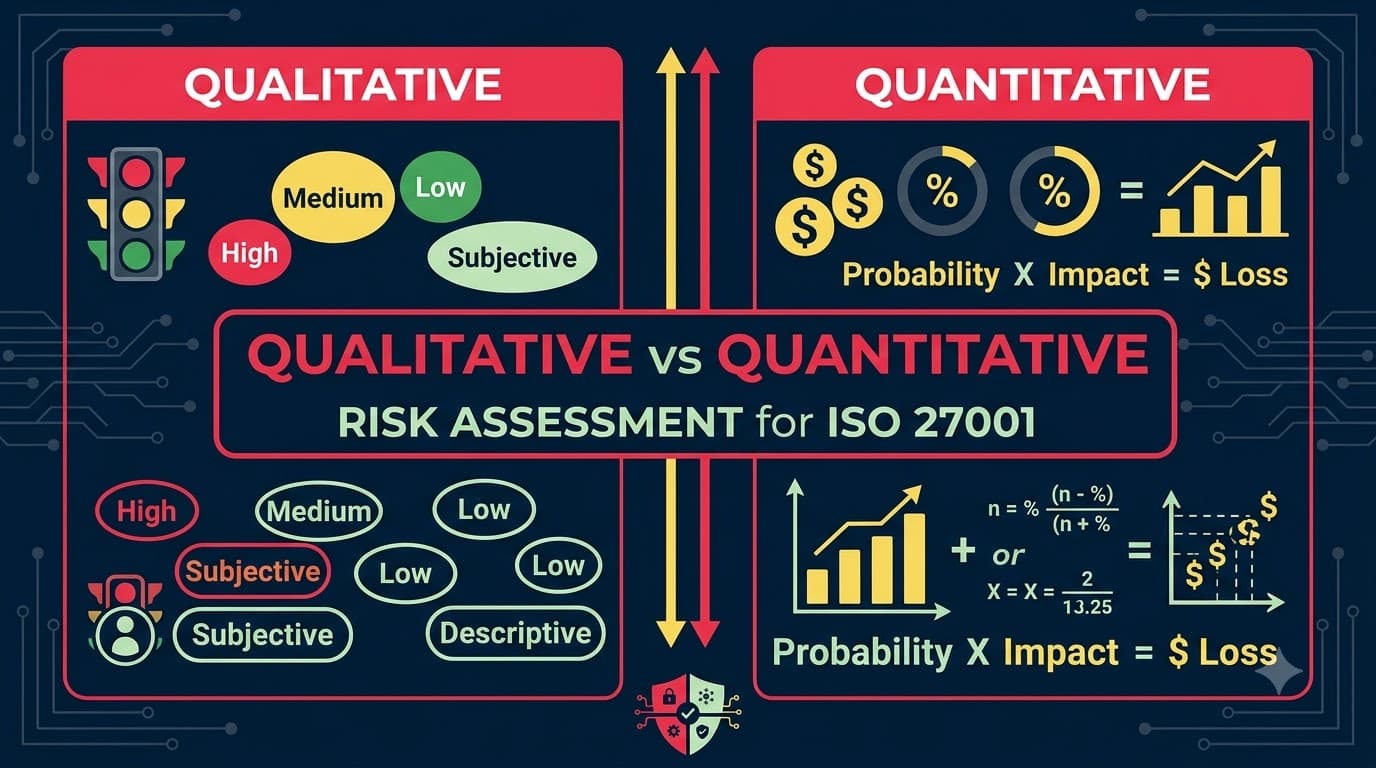
Cold open
Elena Vasquez had built her career on precision. Fifteen years in actuarial risk before she pivoted into information security, and when she took the CISO seat at Corvium Payments — a Denver-based payment processor handling roughly $4.2 billion in annual transaction volume for 6,000 small-business merchants — she brought that precision with her. Her first ISMS risk assessment, built to satisfy ISO/IEC 27001:2022 Clause 6.1.2, used exactly what she'd used at every other company: a 5×5 heat map. Likelihood down the side, impact across the top, cells colored green, amber, and red. Forty-one risks, all landing neatly into a matrix that fit on a single slide.
She presented it to the board in March, expecting nods. Instead, she got Raymond Okafor, the board's audit committee chair and a former CFO of a reinsurance firm, leaning forward and asking a question that stopped the meeting cold: "Elena, this cell says 'high likelihood, high impact' for a ransomware event against our merchant settlement system. What does 'high impact' mean in dollars? Because next month I'm renegotiating our cyber insurance program, and the broker wants a defensible loss estimate, not a color."
Elena didn't have an answer. Not because the underlying analysis was wrong — her team had genuinely assessed likelihood and impact using the best judgment of six subject-matter experts — but because the qualitative matrix, by design, doesn't translate to currency. Amber doesn't tell an insurance underwriter whether Corvium needs a $2 million sublimit or a $20 million one. It doesn't tell the board whether to approve a $650,000 investment in a new fraud-detection platform or defer it another year. The heat map had done exactly what heat maps are built to do: triage forty-one risks into a fast, defensible priority order. It had not done what Raymond needed, which was a monetary answer to a monetary question.
Six weeks later, Elena's team produced a second document: a quantitative analysis of the same top five risks using annualized loss expectancy calculations, benchmarked against Corvium's own three years of fraud-loss data and industry breach-cost figures. The ransomware scenario against the settlement system came back with a modeled annualized loss expectancy of $616,000, with a plausible single-incident range running well into seven figures depending on dwell time and whether the attacker reached the core ledger. Raymond took that number to the insurance broker. Corvium ended up increasing its primary cyber layer and negotiated a materially better rate than the broker's initial quote, because the underwriter could see the analytical rigor behind the ask.
Here's the twist most consultants won't tell you: Elena's qualitative matrix wasn't wrong, and her quantitative model wasn't automatically "better." Both were legitimate ISO 27001 risk assessment methodologies. The mistake was using only one tool for two very different audiences and two very different decisions. That's the problem this article solves.
Who this is for and what you'll walk away with
This article is for ISO 27001 implementers, CISOs, risk managers, and internal auditors who are choosing — or defending — a risk assessment methodology under Clause 6.1.2, and for anyone who has sat in a board or audit meeting where "High/Medium/Low" satisfied nobody. You'll walk away knowing exactly what ISO 27001 requires (and doesn't require) of your methodology, how to build and defend a qualitative 5×5 matrix, how to build a semi-quantitative scored model as a middle path, how to run the classic SLE/ALE/ARO quantitative calculation and where FAIR and Monte Carlo simulation fit, and — most importantly — how to combine approaches so you get the speed of qualitative triage and the credibility of quantitative depth where it counts.
What ISO 27001 actually requires (and doesn't)
Here is the single most important fact in this article, and the one most consultants gloss over: ISO/IEC 27001:2022 does not mandate qualitative risk assessment, quantitative risk assessment, or any specific scoring scale. Clause 6.1.2 requires that your organization "define and apply an information security risk assessment process" that establishes and maintains risk criteria, including risk acceptance criteria and criteria for performing risk assessments, and — this is the load-bearing phrase — "ensures that repeated information security risk assessments produce consistent, valid and comparable results."
Consistent, valid, comparable. Nowhere in that clause, nor in the earlier general risk-assessment framing in ISO 27001 Clause 6: Planning — Risk Assessment and Objectives, does the standard specify how you measure likelihood or impact. It doesn't require dollars. It doesn't require a 5×5 matrix. It doesn't require FAIR, Monte Carlo simulation, or any named methodology at all. What it requires is that whatever method you choose produces the same kind of answer when applied by different assessors to different risks at different times — so that a "High" risk assessed in January means the same thing as a "High" risk assessed in September, and so that risks can be meaningfully ranked against one another.
This matters because I have watched organizations burn six-figure consulting budgets building elaborate quantitative models under the mistaken belief that an auditor would demand dollar figures, and I've watched other organizations get flagged in a Stage 2 audit not because their qualitative matrix was insufficiently rigorous in an absolute sense, but because it was inconsistently applied — one business unit scoring "impact" against revenue loss, another against reputational damage, with no shared reference scale connecting the two. Auditors checking conformance to the ISO 27001 Risk Assessment Methodology are testing for a documented, repeatable, defensible process — not for a specific number system.
That said, the choice isn't neutral. Qualitative, semi-quantitative, and quantitative methods trade off differently on speed, defensibility, data requirements, and — critically — audience. A board that thinks in dollars, like Raymond Okafor, will find a heat map frustratingly vague. A twelve-person startup with no loss history will find a full FAIR model an expensive fiction dressed up as precision. Getting this choice right, and knowing when to blend approaches, is what separates a risk assessment that merely passes audit from one that actually drives better security investment decisions.
"I've had auditors ask me to justify why we call something 'Medium' instead of 'Moderate.' What they're actually testing is whether our scale is written down, applied the same way every time, and understood by the people using it. Nobody has ever failed my audit for choosing qualitative over quantitative. People fail because their scoring is inconsistent." — Priya Nakamura, Lead Auditor, Meridian Certification Body
Qualitative risk assessment: the fast, subjective baseline
Qualitative risk assessment measures likelihood and impact using descriptive categories — High/Medium/Low, or a numbered scale like 1–5 where each number maps to a written description rather than a monetary or statistical value. It's the most widely used approach in ISO 27001 programs, particularly in organizations running their first one or two ISMS cycles, because it requires no historical loss data, no actuarial modeling, and can be run by a small cross-functional group in a matter of days rather than months.
The mechanics are simple and that simplicity is the entire point. You define a likelihood scale (how probable is it that a given threat exploits a given vulnerability in the next twelve months) and an impact scale (how severe would the consequences be to confidentiality, integrity, or availability). Each risk scenario — say, "unpatched VPN concentrator exploited by an external attacker leading to unauthorized access to customer PII" — gets a likelihood rating and an impact rating from your team of subject-matter experts. The two ratings are plotted on a matrix, and the matrix cell determines the risk's priority tier.
The 5×5 matrix, worked example
Below is a representative 5×5 matrix using a numbered likelihood and impact scale (1 = lowest, 5 = highest), with the resulting risk score calculated as Likelihood × Impact, and priority bands assigned to score ranges.
Table 1: Qualitative 5×5 Likelihood/Impact Scale Definitions
Rating | Likelihood Definition | Impact Definition |
|---|---|---|
1 – Rare | Expected less than once in 5 years | Negligible operational disruption; no reportable data exposure |
2 – Unlikely | May occur once in 2–5 years | Minor disruption; contained to single team; no regulatory exposure |
3 – Possible | May occur once in 1–2 years | Moderate disruption; localized data exposure; possible client notification |
4 – Likely | Expected at least once a year | Significant disruption; multi-system outage; regulatory notification required |
5 – Almost Certain | Expected multiple times a year | Severe, potentially existential; large-scale breach, major regulatory fines, executive turnover |
Table 2: Worked 5×5 Risk Matrix — Corvium Payments Sample Risk Register Extract
Risk Scenario | Likelihood (1–5) | Impact (1–5) | Score (L×I) | Priority Band |
|---|---|---|---|---|
Ransomware against merchant settlement system | 4 | 5 | 20 | Critical |
Phishing-driven credential compromise of finance staff | 4 | 4 | 16 | High |
Unpatched public-facing API gateway | 3 | 4 | 12 | High |
Third-party payment gateway outage | 3 | 3 | 9 | Medium |
Insider misuse of privileged database access | 2 | 5 | 10 | Medium |
Loss of unencrypted laptop (field sales) | 2 | 3 | 6 | Low |
Data center power failure (single site) | 2 | 2 | 4 | Low |
Misconfigured cloud storage bucket | 3 | 4 | 12 | High |
Table 3: Priority Band Definitions and Response Expectations
Score Range | Priority Band | Expected Response |
|---|---|---|
15–25 | Critical | Immediate treatment plan, executive visibility, reviewed monthly |
10–14 | High | Treatment plan within current cycle, reviewed quarterly |
5–9 | Medium | Treatment plan or accepted risk with sign-off, reviewed semi-annually |
1–4 | Low | Monitor, accept, or address opportunistically |
This is the core artifact that feeds directly into How to Build an ISO 27001 Risk Register — every row above becomes a register entry, and the priority band drives the sequencing of your Risk Treatment Plan: ISO 27001 Implementation Guide.
Why practitioners default to qualitative
Speed and accessibility are the real draw. A qualitative workshop with the right stakeholders in the room — IT operations, application owners, legal, HR, a business unit lead — can triage forty or fifty risk scenarios in a single half-day session. Nobody needs a statistics background to participate, and nobody needs twelve months of incident data that most organizations, especially smaller ones, simply don't have. It's also intuitively auditable: an assessor can look at a scored matrix and immediately understand the relative priority of every risk without needing to interrogate a probability distribution.
Where qualitative breaks down
The weaknesses are equally real. First, subjectivity: two equally competent risk owners can rate the same scenario differently, and without well-anchored scale definitions (like the ones in Table 1), "High" becomes whatever the loudest voice in the room believes it is. Second, false precision in the multiplication: treating a Likelihood × Impact score as if it were a real number invites people to compare a 12 and a 10 as though the difference were meaningful, when the underlying inputs are ordinal categories, not measurements. Third — and this is the one that burned Elena — qualitative output doesn't translate into currency, so it's the wrong tool the moment your audience is a CFO, an insurance underwriter, or a board deciding between two capital allocations.
Table 4: Qualitative Risk Assessment — Pros and Cons
Pros | Cons |
|---|---|
Fast to run; workshop-based, days not months | Subjective; dependent on assessor judgment and anchoring |
No historical loss data required | Not defensible to finance/insurance audiences who need dollars |
Easy for non-specialists to participate and understand | Risk of false precision from multiplying ordinal scores |
Cheap — no specialized tooling or actuarial skill needed | Inconsistent application across business units without strong scale definitions |
Naturally supports fast prioritization and triage | Hard to model cumulative or aggregated risk across the register |
Well understood by auditors as a valid ISO 27001 approach | Doesn't answer "how much should we spend to fix this?" |
"Qualitative gets a bad reputation from people who do it badly. A well-anchored 5×5 matrix with written scale definitions, applied consistently by trained risk owners, will satisfy Clause 6.1.2 every single time. The problem isn't the method — it's organizations that skip the anchoring step and let 'High' mean five different things depending on who's in the room." — Deborah Kessler, ISMS Manager, Northfield Logistics
Semi-quantitative risk assessment: the middle path
Semi-quantitative assessment keeps the workshop-friendly structure of qualitative scoring but replaces vague descriptive bands with numeric scales anchored to something closer to real-world reference points — dollar ranges, percentage probability bands, or weighted multi-factor scores. It's not a full monetary model; it's qualitative judgment expressed with more numeric discipline, and it's the approach I recommend most often to organizations in their second or third ISMS cycle who have outgrown "High/Medium/Low" but don't yet have the loss history or analytical bandwidth for a full FAIR model.
The most common semi-quantitative technique assigns numeric weights to multiple risk factors — not just likelihood and impact, but sub-factors like data sensitivity, number of records affected, regulatory exposure, and detection difficulty — and combines them into a composite score, often normalized to a 0–100 or 1–10 scale. This lets you rank risks with finer granularity than a 25-cell matrix allows, while still requiring only estimation, not statistical modeling.
Worked example: weighted scoring model
Table 5: Semi-Quantitative Weighted Scoring Factors
Factor | Weight | Scale |
|---|---|---|
Likelihood of occurrence | 30% | 1 (rare) – 10 (near-certain) |
Financial impact range | 25% | 1 (<$10K) – 10 (>$5M) |
Regulatory/legal exposure | 20% | 1 (none) – 10 (severe, multi-jurisdiction) |
Reputational impact | 15% | 1 (negligible) – 10 (national media, client attrition) |
Detection/containment difficulty | 10% | 1 (automated, instant) – 10 (manual, weeks) |
Table 6: Worked Semi-Quantitative Scores — Corvium Payments Sample
Risk Scenario | Likelihood (30%) | Financial (25%) | Regulatory (20%) | Reputational (15%) | Detection (10%) | Composite Score |
|---|---|---|---|---|---|---|
Ransomware against merchant settlement system | 8 | 9 | 8 | 9 | 7 | 8.15 |
Phishing-driven credential compromise | 8 | 6 | 6 | 6 | 5 | 6.65 |
Misconfigured cloud storage bucket | 6 | 7 | 8 | 6 | 4 | 6.45 |
Third-party payment gateway outage | 5 | 5 | 4 | 5 | 3 | 4.55 |
Loss of unencrypted laptop (field sales) | 3 | 3 | 5 | 3 | 2 | 3.35 |
The composite score column is calculated as (Likelihood × 0.30) + (Financial × 0.25) + (Regulatory × 0.20) + (Reputational × 0.15) + (Detection × 0.10). Composite scores above 7.5 might trigger "Critical" treatment, 5.0–7.5 "High," 3.0–4.9 "Medium," and below 3.0 "Low" — you set these thresholds during methodology design and document them the same way you would matrix bands, per the consistency requirement in Clause 6.1.2.
Why semi-quantitative earns its middle-path label
It genuinely does more than qualitative scoring — it lets you weight the factors that matter most to your specific risk appetite (a healthcare organization might weight regulatory exposure at 35% instead of 20%; a consumer brand might weight reputational impact higher), and the finer numeric granularity reduces the "clustering" problem where a 5×5 matrix forces genuinely different risks into the same cell. It's also a natural stepping stone: organizations that outgrow semi-quantitative scoring for their top handful of risks often migrate those specific scenarios into full quantitative modeling, which is exactly the "combining approaches" strategy covered later in this article.
It isn't free of qualitative's core weakness, though — the underlying inputs (a "7" for financial impact) are still expert judgment, just judgment expressed with more decimal places. The illusion of precision is a real risk here: a composite score of 6.65 sounds more rigorous than "Medium/High," but if the underlying weight assignments were never validated against actual loss experience, decimal precision is theater.
Table 7: Semi-Quantitative — Pros and Cons
Pros | Cons |
|---|---|
More granular ranking than a 25-cell matrix; fewer ties | Weighting scheme itself is subjective unless validated with real data |
Lets you tune factor weights to organizational risk appetite | Still not expressed in currency — doesn't fully satisfy finance/insurance audiences |
Easier bridge to full quantitative modeling for top risks | Can create false confidence from numeric precision |
Workshop-compatible; doesn't require loss history | Requires more upfront design work to define factors and weights |
Supports comparison across departments better than raw qualitative | More complex to explain to non-technical stakeholders than "High/Med/Low" |
"Semi-quantitative is where most of my mature clients land permanently. It's not a stepping stone for everyone — for a 200-person manufacturing company, a well-designed weighted score is the right level of rigor forever. Full quantitative modeling is a tool for specific high-stakes decisions, not a maturity finish line every organization needs to reach." — Thomas Bergstrom, Principal Risk Consultant, Ashford GRC Partners
Quantitative risk assessment: monetizing risk
Quantitative risk assessment expresses risk in monetary terms — typically an estimated annual dollar loss — using measurable or estimated inputs rather than descriptive categories. It's the approach Elena's team turned to after the board meeting, and it's the only approach of the three that answers the question "how many dollars of risk does this represent, and how many dollars should we spend to reduce it?" directly.
The classic model: SLE, ARO, and ALE
The foundational quantitative technique, used for decades in information security risk practice, relies on three figures:
Single Loss Expectancy (SLE) — the expected monetary loss from a single occurrence of a risk event, calculated as:
SLE = Asset Value (AV) × Exposure Factor (EF)
Asset Value is the value of the asset at risk (a system, a dataset, a business process) expressed in dollars. Exposure Factor is the percentage of that asset's value expected to be lost in a single incident — not every ransomware event destroys 100% of a system's value; a well-segmented environment might only lose 40–60% of an affected system's functional value even during a serious incident.
Annualized Rate of Occurrence (ARO) — the estimated number of times the event is expected to occur in a year, based on historical incident data, industry benchmarks, or expert estimation when data is thin (0.1 means once every ten years; 2.0 means twice a year).
Annualized Loss Expectancy (ALE) — the expected annual monetary loss from the risk, calculated as:
ALE = SLE × ARO
Worked example: Corvium's ransomware scenario, quantified
Table 8: SLE / ARO / ALE Worked Calculation — Ransomware Against Merchant Settlement System
Input | Value | Basis |
|---|---|---|
Asset Value (settlement system, incl. 3-day revenue impact + remediation) | $3,200,000 | Illustrative — average daily settlement volume × downtime days + recovery cost estimate |
Exposure Factor | 55% | Illustrative — partial segmentation limits blast radius; core ledger isolated |
Single Loss Expectancy (SLE = AV × EF) | $1,760,000 | Calculated |
Annualized Rate of Occurrence | 0.35 | Illustrative — informed by sector threat intelligence and Corvium's 3-year incident history |
Annualized Loss Expectancy (ALE = SLE × ARO) | $616,000 | Calculated |
Table 9: SLE / ARO / ALE — Multiple Risk Scenarios Compared
Risk Scenario | Asset Value | Exposure Factor | SLE | ARO | ALE |
|---|---|---|---|---|---|
Ransomware — settlement system | $3,200,000 | 55% | $1,760,000 | 0.35 | $616,000 |
Phishing — finance credential compromise | $850,000 | 40% | $340,000 | 0.60 | $204,000 |
Misconfigured cloud storage exposure | $1,100,000 | 30% | $330,000 | 0.25 | $82,500 |
Third-party gateway outage (4 hrs) | $220,000 | 90% | $198,000 | 0.80 | $158,400 |
Lost unencrypted field laptop | $180,000 | 20% | $36,000 | 0.50 | $18,000 |
Once you have ALE for a risk, the classic follow-on question is whether a proposed control is worth its cost — the annual cost of a safeguard should generally be lower than the ALE reduction it delivers. If a $180,000-a-year investment in endpoint detection and response is projected to cut ransomware ARO from 0.35 to 0.12, the new ALE drops to roughly $211,000, a reduction of about $405,000 — comfortably justifying the spend. This is the exact kind of return-on-control argument that makes quantitative modeling powerful when you're building a business case, and it dovetails with the broader ROI narrative in ISO 27001 Certification Benefits: Business Case and ROI, where quantifying risk reduction in dollar terms is often the single most persuasive lever with a skeptical board.
FAIR: a more rigorous probabilistic alternative
Factor Analysis of Information Risk (FAIR) is the most widely adopted formal quantitative model in the security industry beyond the basic SLE/ALE approach. Rather than a single deterministic ARO and EF, FAIR decomposes risk into loss event frequency (broken further into threat event frequency and vulnerability) and loss magnitude (broken into primary loss and secondary loss, covering things like regulatory fines, legal costs, and reputational or customer-attrition effects). Each input is expressed as a probability distribution — a minimum, most likely, and maximum estimate — rather than a single point figure, which better reflects genuine uncertainty than a single ARO number pretending to be precise.
FAIR is illustrative of a broader category: probabilistic quantitative modeling that acknowledges you rarely know the "true" frequency or magnitude of a risk, only a defensible range. It requires more analytical skill to run properly (calibrated estimation training for the experts providing input ranges is a real practice within the FAIR community) and it is data-hungrier than SLE/ALE, but it produces output — typically a loss exceedance curve — that answers a more sophisticated question than a single ALE figure: "what's the probability that losses from this risk exceed $2 million in a given year?"
Monte Carlo simulation
Monte Carlo simulation is the computational engine that usually sits behind a FAIR analysis (and behind other probabilistic quantitative models). Instead of calculating a single ALE from single-point inputs, the analyst defines a distribution for each input — say, loss event frequency ranging from 0.1 to 0.6 times a year, and loss magnitude ranging from $200,000 to $4 million — and a simulation engine runs the calculation tens of thousands of times, each time randomly sampling a value from within each distribution. The output isn't one number; it's a full distribution of possible annual loss outcomes, from which you can read off statements like "there's a 10% chance annual losses from this risk scenario exceed $1.9 million." That's a materially more useful answer for capital allocation, insurance limit-setting, and board risk appetite conversations than either a single ALE point estimate or a qualitative "Critical" label — at the cost of needing genuine statistical literacy on the team producing and interpreting it.
Table 10: Quantitative Methods Compared — SLE/ALE vs FAIR/Monte Carlo
Attribute | Basic SLE/ARO/ALE | FAIR / Monte Carlo |
|---|---|---|
Output | Single point-estimate dollar figure | Full probability distribution / loss exceedance curve |
Data needs | Moderate — asset values, rough incident rates | High — calibrated range estimates, ideally historical loss data |
Analytical skill required | Basic finance/spreadsheet literacy | Statistical literacy; FAIR training recommended |
Best for | Business-case justification for a single control | Board-level risk appetite, insurance program design, capital planning |
Time to produce | Days | Weeks, for a properly calibrated model |
Table 11: Quantitative Risk Assessment — Pros and Cons
Pros | Cons |
|---|---|
Speaks the language of finance, insurance, and the board | Data-hungry — weak inputs produce a precisely wrong answer |
Directly supports cost-benefit and ROI justification for controls | Time- and skill-intensive relative to qualitative/semi-quantitative |
FAIR/Monte Carlo captures genuine uncertainty as a range, not a false point estimate | Point-estimate SLE/ALE can create false confidence if inputs are guessed, not grounded |
Strong audit trail for regulators, cyber insurance underwriters, M&A due diligence | Hard to run across dozens of risks at once — better for a focused top-tier subset |
Enables meaningful control cost-justification (is a $X safeguard worth it?) | Requires organizational buy-in on asset valuation methodology, which is its own project |
"The number one mistake I see with quantitative modeling is treating a made-up ARO as if it were measured. If you don't have three-plus years of clean incident data, your Annualized Rate of Occurrence is an estimate dressed up as a statistic. That's fine — just say so, and use a range instead of a single point wherever you can." — Anika Reyes, Director of Cyber Risk Quantification, Solvane Analytics
Side-by-side comparison: choosing the right lens
Laid out next to each other, the three approaches stop looking like competing philosophies and start looking like three instruments in the same toolbox, each tuned for a different job. Qualitative is the instrument you reach for when you need to move fast across a wide surface area — an entire register, a new business unit, a vendor onboarding queue. Semi-quantitative is the instrument you reach for when the audience needs finer resolution than five bands but doesn't need currency. Quantitative is the instrument you reach for when a specific dollar figure is about to change someone's mind — an underwriter's, a board's, an acquirer's. The table below puts the trade-offs side by side so you can make that call deliberately rather than by habit or by whichever consultant pitched you last.
Table 12: Qualitative vs Semi-Quantitative vs Quantitative — Side-by-Side
Dimension | Qualitative | Semi-Quantitative | Quantitative |
|---|---|---|---|
Typical output | High/Medium/Low or 1–5 matrix score | Weighted composite score (e.g., 0–10 or 0–100) | Dollar figure (ALE) or probability distribution |
Effort to produce | Low — days | Moderate — 1–3 weeks | High — weeks to months, especially FAIR/Monte Carlo |
Data requirements | Expert judgment only | Expert judgment + defined weights | Asset valuations, loss history, calibrated estimates |
Primary audience | IT/security teams, internal risk owners | Risk committees, mid-level management | Board, CFO, insurers, regulators, M&A due diligence |
Defensibility in audit | High — well understood by ISO auditors | High — shows analytical maturity | High — but only if inputs are documented and defensible |
Best organizational fit | First-time ISMS, small/mid organizations | Second/third-cycle ISMS, most mid-market organizations | Regulated, high-value, or insurance-driven risk decisions |
Comparability across risks | Moderate — clustering in matrix cells | Good — finer granularity | Excellent — directly comparable in dollars |
Weakness | Subjective, not monetized | Still judgment-based under the numbers | Data-hungry; garbage-in-garbage-out risk |
How to choose: maturity, sector, and audience
The honest answer to "which method should I use" is: it depends on three variables, and none of them is "which one is more rigorous in the abstract." The first variable is ISMS maturity. An organization running its first risk assessment cycle, with no incident history and no dedicated risk function, should start qualitative — full stop. Building a FAIR model on top of guessed inputs is worse than a well-anchored 5×5 matrix, because it creates false precision without the data to back it up. Organizations in their second or third cycle, with a functioning risk register and some incident history, are well positioned for semi-quantitative scoring. Organizations with mature GRC functions, multi-year loss data, and board-level scrutiny of risk spending are ready for targeted quantitative modeling on their highest-priority risks.
The second variable is sector. Financial services, insurance, and critical infrastructure organizations — where boards, regulators, and reinsurers all think natively in dollars and probability — gravitate toward quantitative methods faster than a mid-market manufacturer or professional services firm, where a qualitative or semi-quantitative matrix is often perfectly proportionate to the decisions being made. A twelve-person SaaS startup pursuing its first certification for sales-enablement reasons doesn't need FAIR; it needs a clean, consistent qualitative matrix that an auditor can trace from risk register to Statement of Applicability.
The third variable — and the one Elena's story illustrates best — is audience. The same organization, the same risk register, can legitimately need different presentations for different rooms. A security operations team triaging fifty vulnerabilities needs a fast qualitative or semi-quantitative ranking. A board approving a $650,000 control investment, or a CFO negotiating a cyber insurance renewal, needs dollars. Choosing a single methodology and forcing every audience through it is itself a common mistake, covered in more detail below.
Table 13: Method Selection by Organizational Profile
Organizational Profile | Recommended Primary Method | Rationale |
|---|---|---|
First-time ISMS, <100 employees, no loss history | Qualitative | Fast, no data prerequisites, satisfies Clause 6.1.2 with a well-anchored matrix |
Mid-market, 2nd/3rd ISMS cycle, some incident history | Semi-quantitative | Finer ranking, tunable to risk appetite, still workshop-feasible |
Regulated financial services / insurance / critical infrastructure | Quantitative (SLE/ALE baseline, FAIR for top risks) | Board, regulators, and reinsurers require monetary framing |
High-growth company preparing for M&A due diligence | Quantitative for top 5–10 risks | Acquirers and their advisors expect dollar-denominated risk exposure |
Public sector / nonprofit with limited GRC budget | Qualitative or semi-quantitative | Proportionate effort; quantitative rarely justified by decision stakes |
Combining approaches: qualitative triage, quantitative depth
The most effective — and most common among mature programs I've advised — pattern isn't "pick one." It's a two-stage funnel. Run a full qualitative or semi-quantitative pass across your entire risk register, typically forty to eighty scenarios, to get fast, consistent, comparable prioritization across the whole landscape. That satisfies Clause 6.1.2 for the full register and gives you the "Critical/High/Medium/Low" language that internal audit, most staff, and most day-to-day risk conversations need.
Then take the top five to ten risks that land in your "Critical" or "High" band — the ones with real budget or board decisions attached — and run a focused quantitative pass on just those. You don't need SLE/ALE or FAIR on all eighty risks in your register; you need it on the handful where a genuine dollar-denominated business case will change a decision, whether that's a capital investment, an insurance limit, or a risk-acceptance sign-off from the board.
flowchart TD
    A[Full Risk Register: 40-80 scenarios] --> B{Qualitative or Semi-Quantitative Triage}
    B --> C[Low / Medium Priority Risks]
    B --> D[Critical / High Priority Risks]
    C --> E[Monitor, accept, or treat using standard controls]
    D --> F{Decision stakes require monetary justification?}
    F -->|No - internal control decision only| G[Treat using qualitative priority band]
    F -->|Yes - board, insurer, regulator, M&A audience| H[Quantitative Deep-Dive: SLE / ALE / ARO or FAIR]
    H --> I[Dollar-denominated business case for treatment or risk acceptance]
This funnel approach is also the natural bridge between two related methodology choices: whether you're assessing risk asset-by-asset or scenario-by-scenario (see Asset-Based vs Scenario-Based Risk Assessment: Which Approach Fits ISO 27001?) and how granular your underlying ISO 27001 risk assessment methodology documentation needs to be to support both stages without contradicting itself. The key documentation discipline: your methodology document should explicitly state that quantitative deep-dives on select high-priority risks are a defined extension of the standard qualitative process, not an ad hoc departure from it — auditors want to see the "why" and "when" of escalation written down.
"The programs that impress me most in an audit aren't the ones running the fanciest FAIR models across their entire register — that's usually a red flag for wasted effort. It's the ones who can show me a clean qualitative pass across everything and then walk me through why these five risks got a deeper quantitative look and what decision that analysis fed." — Priya Nakamura, Lead Auditor, Meridian Certification Body
Common mistakes
Almost every methodology nonconformity or credibility problem I've been called in to fix traces back to one of a small handful of recurring errors, and none of them are about picking the "wrong" method in the abstract — qualitative, semi-quantitative, and quantitative are all defensible choices. The failures happen in execution: scales that were never written down, models built on invented data, or a single method forced onto an audience it was never designed to serve. The table below is a field guide to the mistakes I see most often, why they happen even to competent teams under deadline pressure, and the specific fix that resolves each one without requiring you to abandon the underlying methodology.
Table 14: Common Risk Assessment Methodology Mistakes
Mistake | Why It Happens | Consequence | Fix |
|---|---|---|---|
Multiplying ordinal qualitative scores as if they were real numbers | Matrix math feels rigorous | False precision; a "12" and "10" treated as meaningfully different | Treat scores as ranking bands, not measurements; document that they're ordinal |
Skipping written scale definitions ("High" undefined) | Time pressure during first ISMS cycle | Inconsistent scoring across assessors/departments; audit nonconformity risk | Publish and train on scale definitions (see Table 1) before scoring begins |
Building a full FAIR model with guessed inputs | Belief that quantitative is inherently "more rigorous" | Confidently wrong dollar figures; worse than an honest qualitative matrix | Reserve quantitative depth for risks with real underlying data or clearly-labeled estimate ranges |
Presenting a single ALE number to the board without a range | Simplicity, deadline pressure | Board treats a rough estimate as certain; bad decisions follow | Present ALE with a plausible range or use Monte Carlo output where stakes justify it |
Using one method for every audience | Not recognizing audience needs differ | Board frustrated by vague heat maps; ops team overwhelmed by dollar modeling for routine patching | Adopt the qualitative-triage-then-quantitative-deep-dive funnel |
Never revisiting ARO/EF or scale definitions after major incidents | "Set and forget" methodology documents | Stale inputs; methodology drifts from Clause 6.1.2's "consistent, valid" requirement over time | Review and recalibrate methodology inputs at least annually or after major incidents |
Letting risk owners self-score without independent review | Resource constraints | Optimistic bias — risk owners underrate their own risks | Independent review or calibration workshop before scores are finalized |
Case studies
Case Study 1 — Corvium Payments (Financial Services, ~450 employees). Following the board meeting described in the cold open, Corvium formalized a two-tier methodology: qualitative 5×5 scoring across its full 63-item risk register, with quantitative SLE/ALE modeling mandatory for any risk scoring "Critical" or carrying an estimated treatment cost above $250,000. Within one certification cycle, the finance function began citing ALE figures directly in capital planning meetings, and the company's cyber insurance renewal saw its primary layer increase materially at a lower rate per dollar of coverage, because the underwriter received a documented quantitative loss model rather than a narrative risk summary.
Case Study 2 — Bramwell & Doyle Legal Services (Professional Services, 85 employees). A mid-sized law firm pursuing its first ISO 27001 certification had no incident history and no dedicated risk function. Early attempts by an external consultant to introduce a weighted semi-quantitative model stalled the project — partners found the scoring workshop confusing and the certification timeline slipped by two months. Reverting to a simple, well-documented qualitative 5×5 matrix with clear scale definitions unblocked the project; the firm passed Stage 2 audit with zero nonconformities related to risk methodology, and the lead auditor specifically noted the scale definitions as a strength.
Case Study 3 — Halvorsen Medical Devices (Manufacturing/MedTech, 310 employees). Preparing for acquisition due diligence, Halvorsen's security team needed to answer an acquirer's advisory firm's direct question: "What is your organization's estimated annual cyber loss exposure?" The existing qualitative register couldn't answer that. The team ran a focused FAIR-style analysis on its twelve highest-priority risks, drawing on three years of incident-ticket data as a rough proxy for loss frequency, producing a loss exceedance curve showing roughly a 10% probability of annual losses exceeding $3.1 million. The acquirer's advisors described the analysis as "materially more credible" than the qualitative summaries provided by two other acquisition targets in the same deal process, and it became a positive factor in due diligence rather than an open question mark.
"Halvorsen's team didn't try to quantify all 90 risks in their register — that would have blown the timeline. They picked the twelve that mattered to the deal and did those properly. That selective rigor is exactly what a due-diligence team wants to see; it signals the security function understands its own risk landscape, not just its compliance checklist." — Marcus Whitfield, Director of Cyber Due Diligence, Ashcombe Capital Advisors
"I tell every client the same thing on day one: don't let a consultant sell you a quantitative model your organization isn't ready to feed with real data. A qualitative matrix you actually maintain beats a quantitative model that goes stale after the first workshop." — Deborah Kessler, ISMS Manager, Northfield Logistics
Strategic close
The methodology debate isn't really about qualitative versus quantitative at all — it's about matching the rigor of your risk assessment to the decision it's meant to support and the audience that has to act on it. A security team triaging its patch backlog doesn't need a Monte Carlo simulation. A board deciding whether to self-insure the next tranche of cyber exposure doesn't want a color-coded heat map. Getting this right is a genuine competitive differentiator: organizations that can move fluidly between fast qualitative triage and rigorous quantitative business cases close capital requests faster, negotiate better insurance terms, and pass through M&A due diligence with fewer open questions — all of which turn your ISO 27001 program from a compliance cost center into a demonstrable driver of better-informed, better-funded security decisions.
If you're building or refining your methodology, don't start from a blank page. Our ISO 27001 Risk Register Template gives you a structure that supports qualitative, semi-quantitative, and quantitative fields side by side, and our Risk Scoring Calculator automates the Likelihood × Impact and weighted-composite math shown in Tables 2 and 6 above so your team spends its time on judgment, not arithmetic. If you want to pressure-test a monetary model before you present it to your board, our Build a Sample Risk Treatment Plan lab walks through exactly the SLE/ALE/ARO worked calculations covered in this article using a guided scenario. And if your organization is earlier in the journey, still deciding whether ISO 27001 certification makes sense at all, our ISO 27001 Gap Analysis Tool and The Complete ISO 27001 Implementation Guide eBook are the right starting points before you invest in methodology design at all.
For a plain-language reference to the terms used throughout this article — SLE, ALE, ARO, risk appetite, risk criteria — see the ISO 27001 Terminology and Glossary. And if you're benchmarking your approach against other frameworks your customers or regulators may ask about, our comparison guide covering ISO 27001 vs Other Security Frameworks: NIST, SOC 2, and PCI DSS Compared is a useful companion — NIST SP 800-30's risk assessment guidance in particular offers its own qualitative and semi-quantitative scales that map closely to the concepts in this article, and organizations pursuing SOC 2 alongside ISO 27001 often find that a FAIR-style quantitative model satisfies both frameworks' risk analysis expectations simultaneously.
Whatever you choose, write it down, anchor your scales, and revisit them at least annually — that's the actual test Clause 6.1.2 is running, and it's the test that keeps your risk assessment useful long after the certificate is on the wall.